
Logscape lets you see everything, a unified view of your entire organisation. With Logscape you can see your entire stack, allowing you to build a correlated view of all your applications and devices, meaning that using Logscape you reduce the number of tools required, for full stack monitoring, to one.
Logscape allows you to see everything, from router access logs, to what your customers are buying, Logscape is capable of data analatyics and visualisation at every level of your companies infrastructure, giving you operational visibility on every device, and every layer, while being capable of displaying that data in a way everyone can understand.
| Role | Layer | Metrics | Appliance | Transport |
| Business | Business Intelligence | Domain Knowledge, Business KPI's | Applications, Transactions | Collector |
| Support | Service Layer | Service Requests, Throughput | Application, Web Access Logs | Collector, NxLog, Syslog |
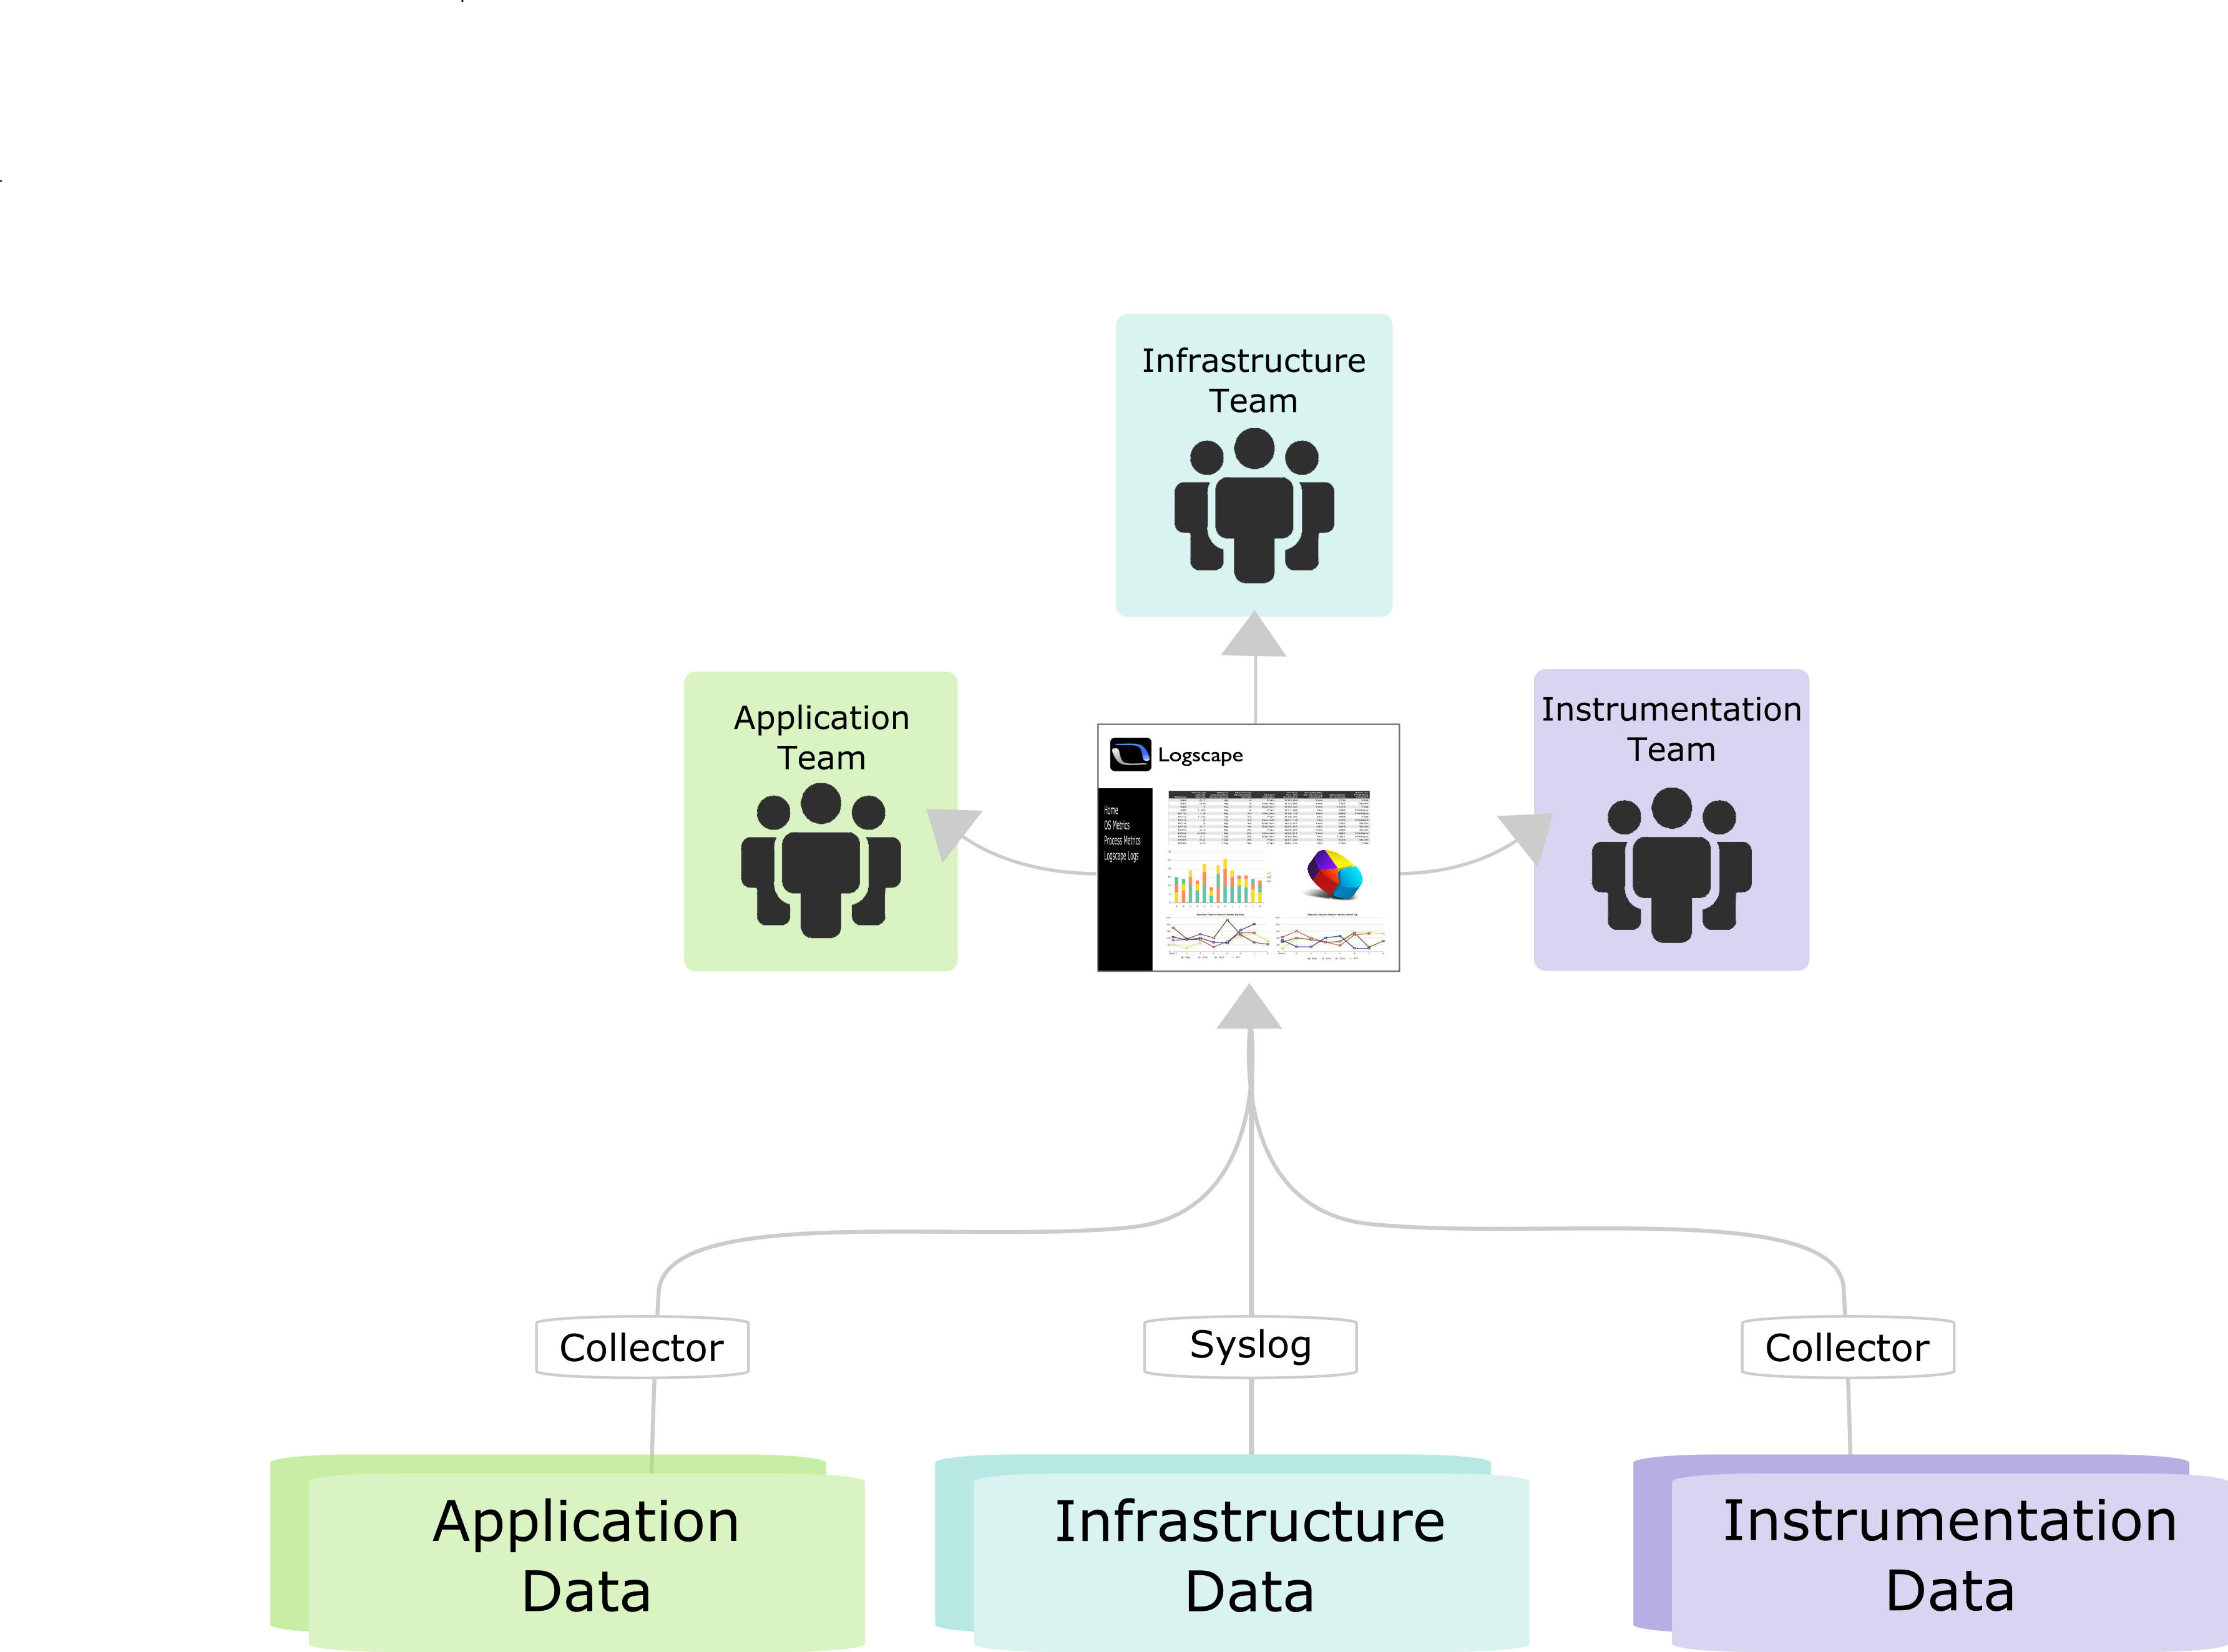
| Ops | Infrastructure | CPU, MEM, Disk, Temp, Fan Speed, Etc | Applications, Web Access | Collector, NxLog, Syslog |
| Dev | Application Layer | Application Health, Status, Performance | ESB, Message Busses, Databases, Web servers | Collector, NxLog, Syslog, Log Shippers |
The Business Intelligence layer makes use of custom metrics collected by the Logscape collector which come in a wide variety forms, such as average Bandwidth per customer, or the cost per page request.
The Service Layer includes metrics relating to throughput in your system, including any service requests made to your system.
Infrastructure metrics are a series of low level statistics relating to your machine, including the operating system, temperatature, total memory, memory usage and cpu.
The Application Layer relates to each individual application running in your enviroment, it can show statistics such as memory usage, slowest loading webpage or the file a thread is currently accessing.