
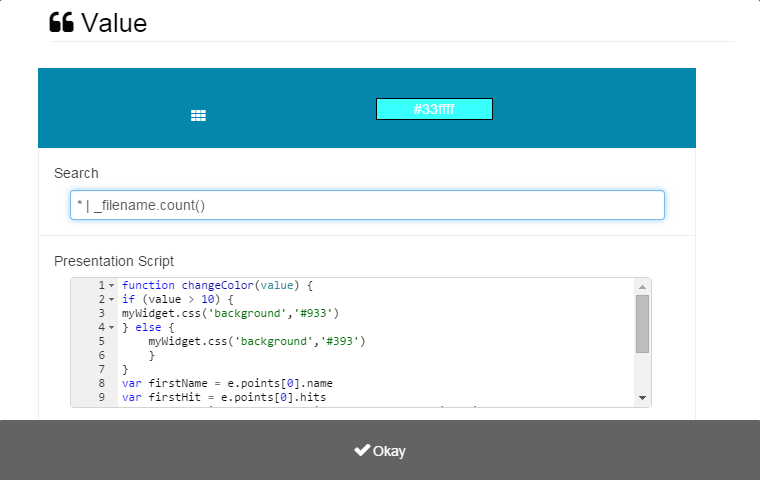
The intention of the Single Value Widget is to not only provide a clear display for data, but also to put more control into the users hand, instead of performing a pre-defined operation on your data, it instead exposes the capability to enter raw javascript and have it executed by the widget. This means that while the widget isn't for everyone, it is exceedingly powerful, allowing you to display your data exactly how you want it.
Today I'm going to show you how to use Chrome's built in developer tools in order to work with the Single Value Widget.
Start off by adding the widget to your workspace, one you've loaded up the widget settings you'll see a default script is included, this script is just a really simple heatmap to show you how things work. We're going to get rid of this, and then using Chromes development tools(f12), navigate to the sources tab and load up value.js and set a breakpoint where "eval(userScript)", currently line 83, is called.
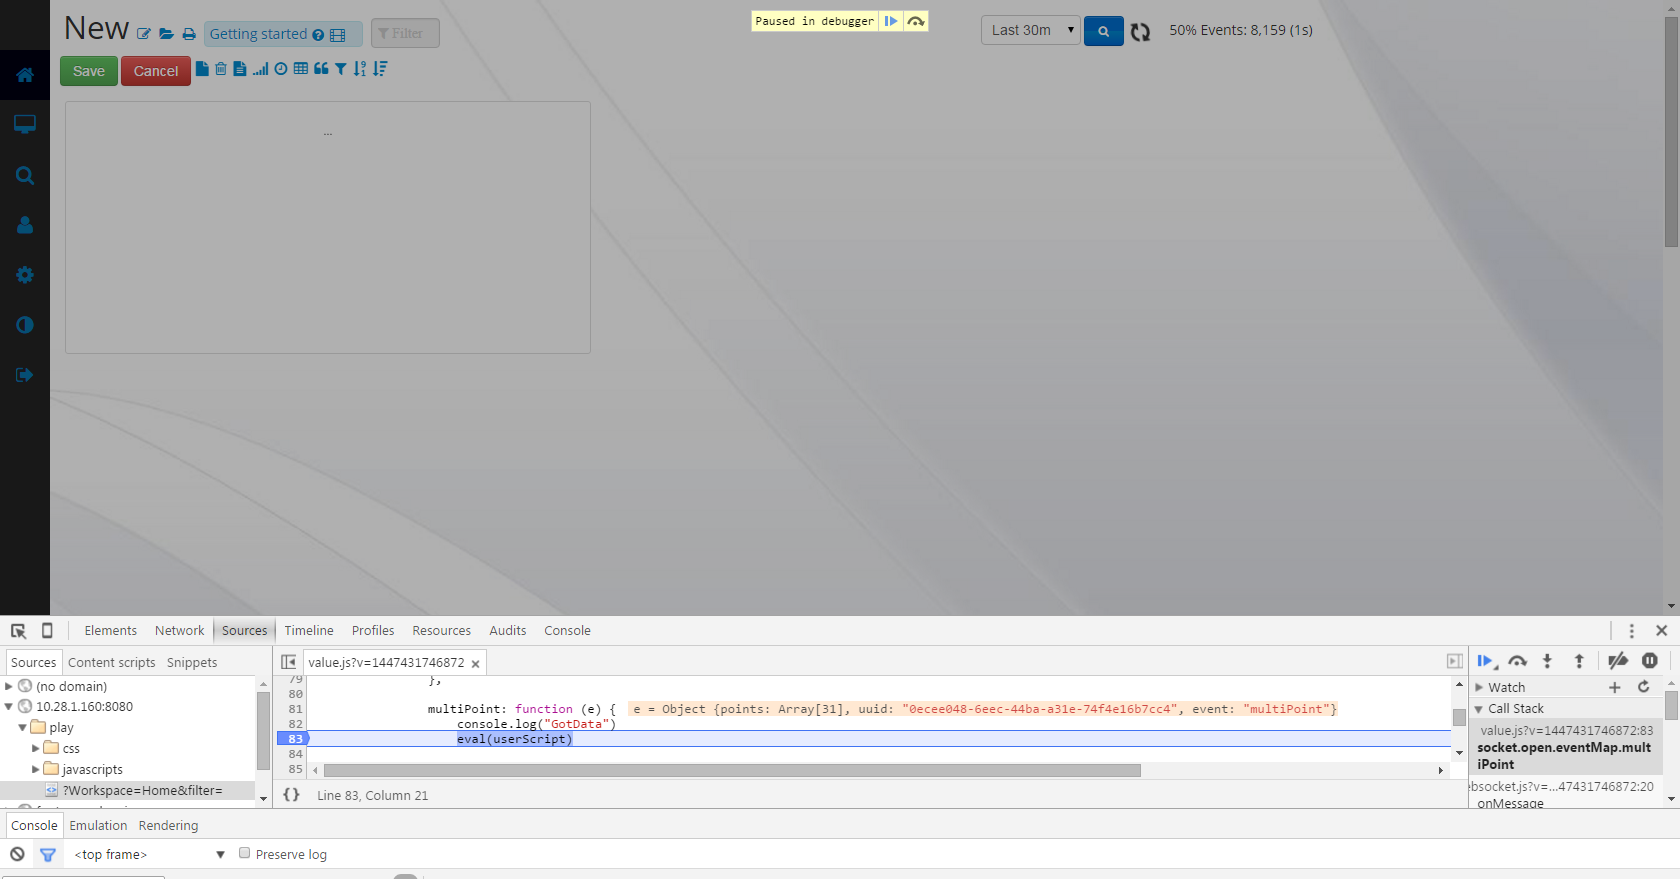
We've now paused the execution of the script, and through the console we have access to all of the variables at this time.
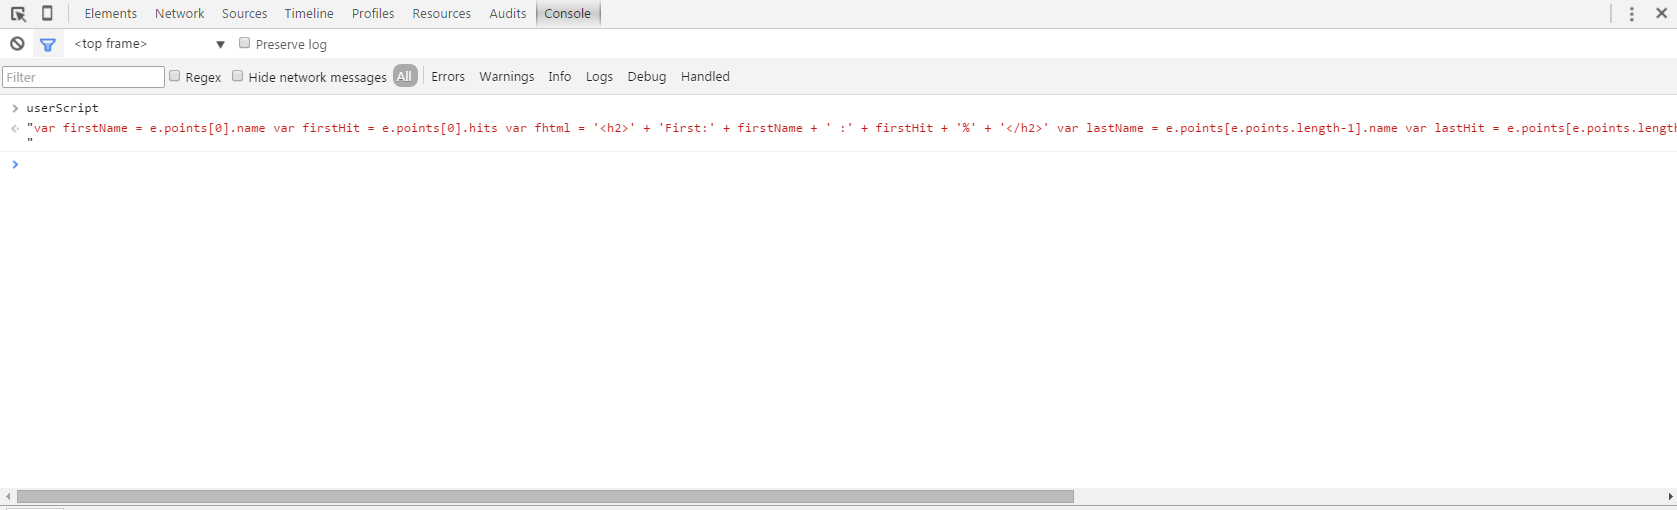
If I call 'userScript' in the console, you'll see any javascript you currently have in the widget.
Now the important part, the object that Logscape returns from its search, and so the object you'll be using when creating your own Javascripts, that object, is 'e', if you enter that into your console while at the breakpoint, you'll see exactly what Logscape returned from your search.
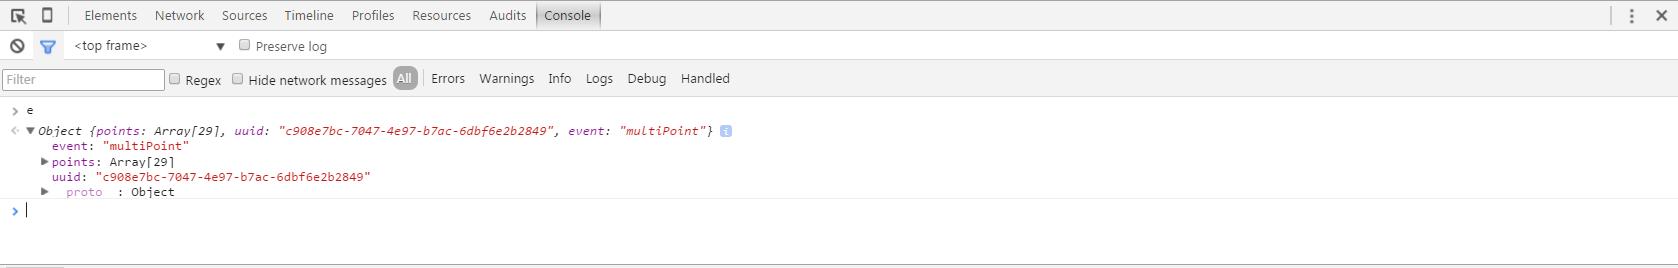
'e', contains an array of points, each point is a value returned from your search, take the below image, this is an example from the search '* | _filename.count()', you can see the the points array with 29 entries, I'm looking at entry 0, the name variable shows me that I'm currently looking at UNIX_BANDWIDTH_wHOST_wTSTAMP.out, and that there was 180 hits for this file.
Once you've manipulated the data how you want, the next step is to manipulate the widget to display your data, the widget you are working inside is stored in the 'myWidget' variable, you can use javascript manipulate the HTML or CSS however you wish.
As an example, the below javascript heatmaps the Single Value panel, when used with the search * | _filename.count()
function changeColor(value) {
if (value > 10) {
myWidget.css('background','#933')
} else {
	myWidget.css('background','#393')
	}
}
var firstName = e.points[0].name
var firstHit = e.points[0].hits
var fhtml = 'First Error:' + firstName + ' :' + firstHit + '%'
var lastName = e.points[e.points.length-1].name
var lastHit = e.points[e.points.length-1].hits
var ehtml = 'Last Error:' + lastName + ' :' + lastHit + '%'
myWidget.find('#valueData').html(fhtml + ehtml)
changeColor(lastHit)
Hopefully this has shone some light on how the Single Value Panel works.
