
The Search syntax follows the pattern shown below. The KEYWORDS are any keywords that appear in your data. They must appear before the pipe symbol Anything after the pipe symbol is a Logscape function which will either specify the way your data is visualized or apply analytics to your data
KEYWORDS | functions
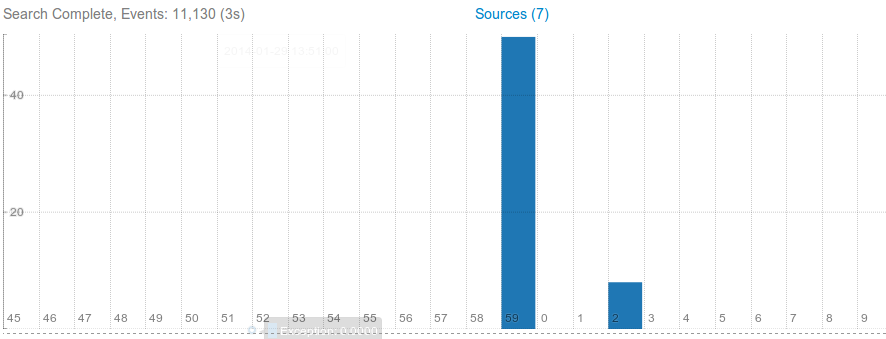
A valid Logscape search can be a simple keyword search. Type in a keyword in the search box will give you all the events that contain that keyword. The example below shows all the events matching the keyword 'Exception'.
Exception
The default chart type if one isn't specified isstacked
Exception | chart(stacked)
You can use the OR and AND operators in your searches as well. The Search below will search for all events containing ERROR or WARN keywords.
ERROR OR WARN
See this example using log4j application data which use the following log levels: INFO,ERROR,WARN,FATAL
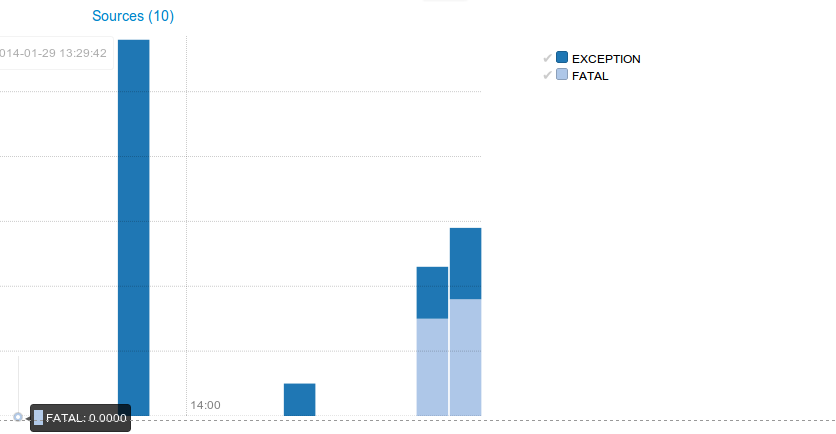
Notice that your results are split into two series. One containing all the ERROR matches and the other containing your WARNS
You may have noticed that the fields section on the search page is updated with results from the each search. Fields can come from 3 different sources
System Fields - These fields contain meta data around the log events, such as the file, host , agent the log event originated from
Discovered Fields - These fields are automagically discovered from you log data with no extra work required on your part. Key Value data in XML files and JSON like data become available to your search
Datatype Fields - These fields come from datatypes that have been assigned to log files. For example,the log4j datatype may be assigned to your logs from your java applications. The datatype will provide fields such as the thread,level,date,message etc to your search.
Fields can be used in searches by placing them after the '|' symbol. The search format looks like this
| field.func1([PARAMS])
The parametes differ based on the function. For most of the numeric functions like max,min,avg you will see the following structure:
| FIELDA.func1([fieldb,alias])
Here are some examples
All your events broken down by filename
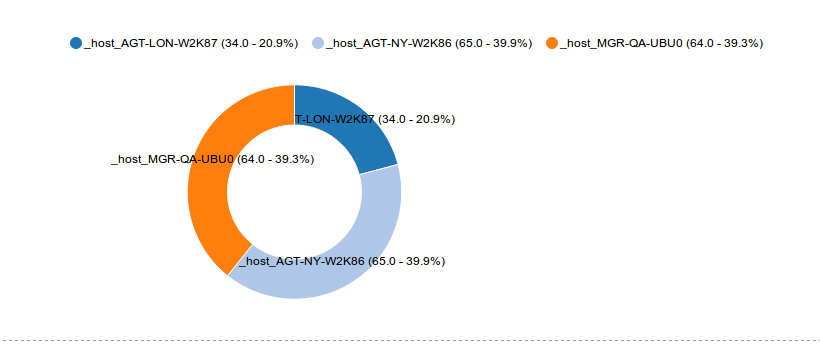
All exceptions broken down by host
All errors and warns broken down by host
You can change your chart type by using the keyword: chart
To get a line chart.
chart(line)
Other chart type available are: clustered,area,pie,table,stream,sparkline and so on. They are all available from the menu.
To get a pie chart use the following syntax.
chart(pie) buckets(1)
buckets(N) - Use a fixed number of buckets for your search.
bucketWidth(TIMEUNIT) - This will use a bucket width set to the TIMEUNIT specified e.g 1m, 2h , 3d. A search spanning an hour using a bucketWidth(1m) will give you 60 buckets in your chart
offset(TIMEUNIT) - This will shift your search back to TIMEUNIT. e.g offset(1h), offset(1d), offset(1w). This is useful for comparing results over a period of time.
The numeric functions use the following syntax
max([FIELD],name)
count,countDelta,max,min,avg(),gt(Num)),lt(NUM),top(NUM)
The string functions will return results match or not matching a textcontains(TEXTA,TEXTB) ,not(TEXT) ,equals(TEXT)
chart(CHARTTYPE),buckets(N),bucketWidth(TIMEUNIT),offset(TIMEUNIT),hitLimit(N)
