Logscape supports multiple search overlays. Overlays are useful for different kinds of data, data from different time periods or for identifying trends. An overlay is created by adding a new search, by pressing the (+) on the search page. There are two important things to remember when writing the searches. Either
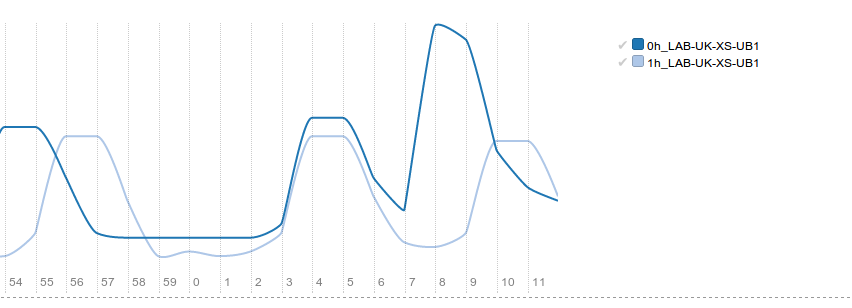
When two searches from the same data are overlayed the series should be labelled. If this does not happen then the results from both searches are merged into the same series and the chart will appear as one line. The first search displays the cpu results of a single host.
cpu | cpu.max(_host,0h) _host.equals(LAB-UK-XS-UB1) chart(line)
The second search collects the cpu metrics of the host from the previous hour.
cpu | cpu.max(_host,1h) _host.equals(LAB-UK-XS-UB1) offset(1h) chart(line)
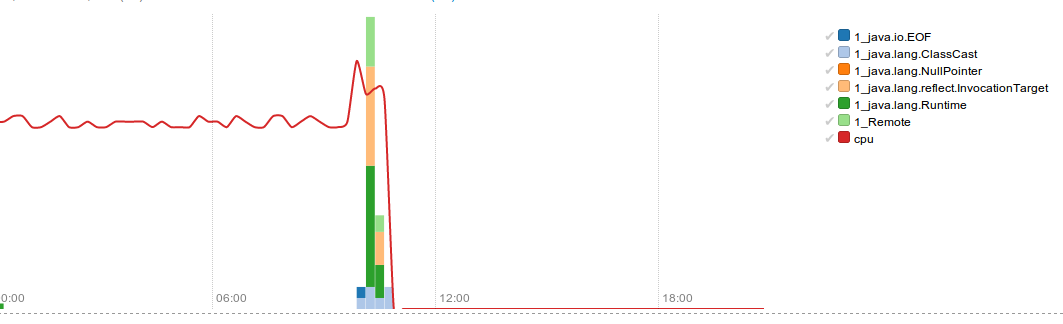
Overlaying data from different types of data can provide useful correlations. The first search displays all the exceptions coming from the host LAB-UK-XS-UB1.
([A-Za-z\.]+)Exception | 1.count() _host.equals(LAB-UK-XS-UB1)
The second search overlays the cpu performance on that host with the volume of exceptions being displayed.
cpu | cpu.max() chart(line) _host.equals(LAB-UK-XS-UB1)