
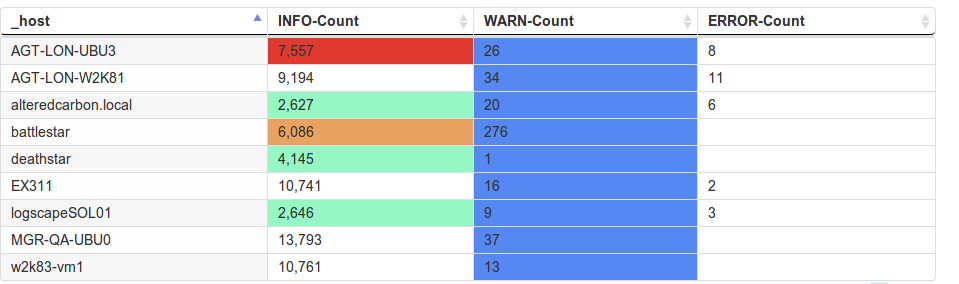
Heatmaps are useful for seeing the overall health of your estate or infrastructure at a glance. They are also useful for interpreting numbers visually. There are two types of heatmaps:
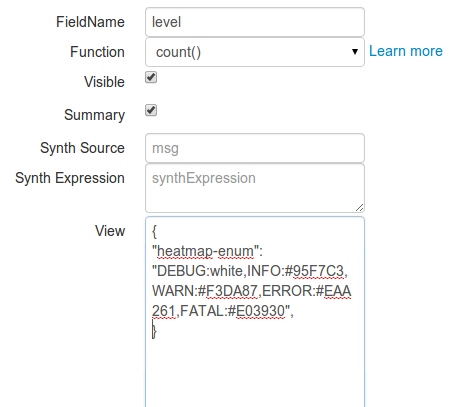
Heatmaps are configured on the Datatypes page. Load the type, and select the field that will have the heatmap applied.
The heatmap syntax:
{ "heatmap-enum:"...."
	,"heatmap-numeric":"..."
}
Heatmaps are configured using a json like syntax. The example below contains the colors for typical log levels
{ "heatmap-enum":"
	 INFO:white
	,DEBUG:#95f7c3
	,WARN:#f3da87
	,ERROR:#EAA261
	,FATAL:E03930
}
The color syntax for the heatmap is similar to CSS:
The numerical heatmap is configured with a range of values. The MIN being the coolest color and numbers approaching the MAX will get the warmest colors
{ "heatmap-numeric":"0-100" }
