Function Reference


  • not(TERM1,TERM2,...TERMN)

    Excludes lines containing keywords TERM1,TERM2. An arbitrary list of terms can used

    Examples:

    Exception | not(Runtime)

    type='log4j' | contains(WARN,ERROR,FATAL)

  • contains(TERM1,TERM2,...TERMN)

    Includes line containing keywords

    Examples:

    type='log4j' | contains(Exception)

    type='log4j' | level.contains(WARN,ERROR,FATAL)

  • gt(NUM),lt(NUM)

    Excludes values greater than or less than NUM

    Examples:

    type='agent-stats' | cpu.gt(60) cpu.avg(_host,) chart(line)

    type='agent-stats' | cpu.gt(20) cpu.lt(60) cpu.avg(_host) chart(line-zero)

  • hosts(pattern1,pattern2,...)

    Returns hosts that match any of the terms. The term can be a regular expression patterns

    Examples:

    | hosts(acme,dc)

    type='agent-stats' | hosts(cache,db) cpu.avg(_host) chart(line)

  • top(NUM,)

    This function sorts the incoming data and returns the top values. Non numerical values are ranked by quantity. By default, searches apply top(50)

    Examples:

    type='agent-stats' | cpu.avg(_host) top(5) chart(pie) buckets(1)

    type='www-xlf' | userAgents.count(_host,) top(7)

  • bottom(NUM,)

    This function sorts the incoming data and returns the lowest values. Non numerical values are ranked by quantity.

    Examples:

    type='agent-stats' | cpu.avg(_host) bottom(5) chart(pie) buckets(1)

    type='www-xlf' | userAgents.count(_host,) bottom(5)

  • avg/average([groupByField],)

    Returns the average of a set values occuring in a single bucket

    Examples:

    type='java-heap' | used.avg(_host,) chart(area)

    type='agent-stats' | cpu.avg() _host.equals(cache.dc0.acme)

  • count([groupByField],)

    Counts the number of hits per bucket. If there is a group by field, each group is represented by a different series

    Examples:

    (*)Exception | 1.count() _filename.equals(app.log)

    * | _host.count() _tag.equals(coherence-logs)

  • countUnique

    Counts only the unique values in each bucket

    Examples:

    | _type.equals(weblogs) refererHost.countUnique() chart(table) buckets(1)

  • first([groupByField] ) / last([groupByField] )

    These two functions are related and return the first value in a bucket and last value respectively. This function can only be used with the table chart type

    Examples:

    | _type.equals(log4j) cpu.last(_host,) buckets(1) chart(table)

  • countSingle/countMembers([groupByField],)

    Counts up to 1 hit per bucket. Use this analytic when you are interested in thenumber of different instances

    Examples:

    WARN (*) | 1.countSingle()

    * | chart(stacked) _host.countSingle()

  • countDelta([groupByField],)

    tracks the counts of value and displays the different when there is a change

    Examples:

    (*)Exception | 1.countDelta()

    type='coh-logs' member:(*) | 1.countDelta()

  • max/min([groupByField],)

    Returns the max/min value for a field in each bucket. If the groupByField is used, the max/min value will be returned for each different group

    Examples:

    type='agent-stats' | mem.max() _host.count()

    type='agent-stats' | mem.max(_host,)

  • sum([groupByField,)

    Adds all the field values per bucket.

    Examples:

    type='db-caches' | storageUtilized.sum(cacheNodeId,)

    type='unx-df' | diskMB.sum()

  • chart(CHARTTYPE)

    Select visualization for data. The default chart type is stacked, you may also specify the number of buckets in your chart with buckets(n).When using the table chart type you may also specify the sorting column with sort(n, asc/desc)There is now also the option to make use of d3pie instead of the standard pie library. This can be accessed via chart(d3pie)

    Examples:

    | cpu.avg(line-connect)

    type='unx-io' | diskUtil.max(_host,) chart(area)

  • c3.(ChartType)

    Override the default library and instead make use of the c3 charting library.

  • buckets(N)

    Specifies the number of buckets used for the chart type. This gives finer control over the render of the chart.

    Examples:

    type='unx-mem' | memutil.avg(_host,) chart(pie) buckets(1)

    | mem.avg(_host,) chart(clustered) buckets(5)

  • bucketWidth(DURATION)

    Specifies the size of each bucket in the chart visualization

    Examples:

    | bucketWidth(1m) _host.count() type.equals(log4j)

    | membersJoined.count(nodeId,) bucketWidth(30s)

  • hitLimit(N)

    The hitlimit controls the number of events returned by a search. When the hitlimit is enabled it prunes the search when the number of hits exceeds N in a particular bucket. This function is often used to get an estimate of the data's shape and behaviour going back several months.

    Examples:

    #EXAMPLE1

    #EXAMPLE2

  • replay(false)

    controls whether or not log-line data is retrieved - in some cases where multiple searches are executed, it may be useful to restrict log-retrieval as you only want to visualise the results (in the chart i.e. CPU values against ERROR)

    Examples:

    type='log4j' ERROR OR WARN | replay(false) _host.count()

    (*)Exception | 1.count() chart(stacked) replay(false)

  • sort([ColumnNumber],asc), sort([ColumnNumber],desc)

    Controls which column sorts a table, and whether the sort is ascending or descending.

    Examples:

    | _type.contains(unx-io,unx-bw,unx-cpu,unx-df,unx-free,unx-pcount) pcount.last(server,pcount%-) await.max(server,diskWaitMs-) rxMBs.max(server,rMBs-) txMBs.max(server,sMBs-) CpuUtilPct.avg(server,cpu%-) FsUsedPct.max(server,diskUsedPct) memUsedPct.avg(server,memUsedPct) chart(table) buckets(1) sort(2, asc)

  • sort([ColumnNumber],asc,[SortColumn2], desc)

    Controls which two columns sort a table, and whether the sort is ascending or descending.

    Examples:

    | _type.contains(unx-io,unx-bw,unx-cpu,unx-df,unx-free,unx-pcount) pcount.last(server,pcount%-) await.max(server,diskWaitMs-) rxMBs.max(server,rMBs-) txMBs.max(server,sMBs-) CpuUtilPct.avg(server,cpu%-) FsUsedPct.max(server,diskUsedPct) memUsedPct.avg(server,memUsedPct) chart(table) buckets(1) sort(2, asc)

  • ttl(DURATION)

    The ttl is how long Logscape will wait for the search results before timing out. The default is 3 minutes. After which all search and replay requests expire and the data is displayed.

    Examples:

    | _host.count () ttl(10)

  • elapsed(LABEL,S1,S2,timeunit)

    Elapsed plots the time duration between START and END. S1 and S2 terms refer to keywords which mark the beginning and end of what's being timed.

    Examples:

    Performance | msg.elapsed(Total,Start Batch, End Batch,m) chart(clustered)

    Task | msg.elapsed(timeTaken,task start,task end)

  • values()

    Plots the occurences of a value per bucket

    Examples:

    * | USED.values()

  • avgDelta()

    Plots average difference between values

    Examples:

    * | USED.avgDelta()

  • avgDeltaPc()

    Plots average difference between values as a percentage of the total value

    Examples:

    * | USED.avgDeltaPc()

  • percentile()

    When used without an argument will list all percentile bands for the value. When used with an argument will present how many records can be found above this percentile value, useful for capturing when values exceed the normal range.

    Examples:

    * | _type.equals(win-cpu) ProcessorPct.percentile(,) chart(line)

    * | _type.equals(win-cpu) ProcessorPct.percentile(,96) chart(line)

  • transform()

    Apply a groovy script that will evaluate upon other pre-evaluated fields (/!\ search field analytic order) and also allow the use of 'constant' field values

    Examples:

    transform(groovy-script: [my-groovy-script])

  • eval()

    Apply commands to the results of the original search, using either alias'd fields or, the EACH keyword. The purpose of EACH is to apply the operation to every piece of data returned. i.e

    Examples:

    Eval a host grouped by another value

    CPU | CPU.max(_host,M) eval(EACH * 100)

    This will multiply the Max CPU for each host, resulting in

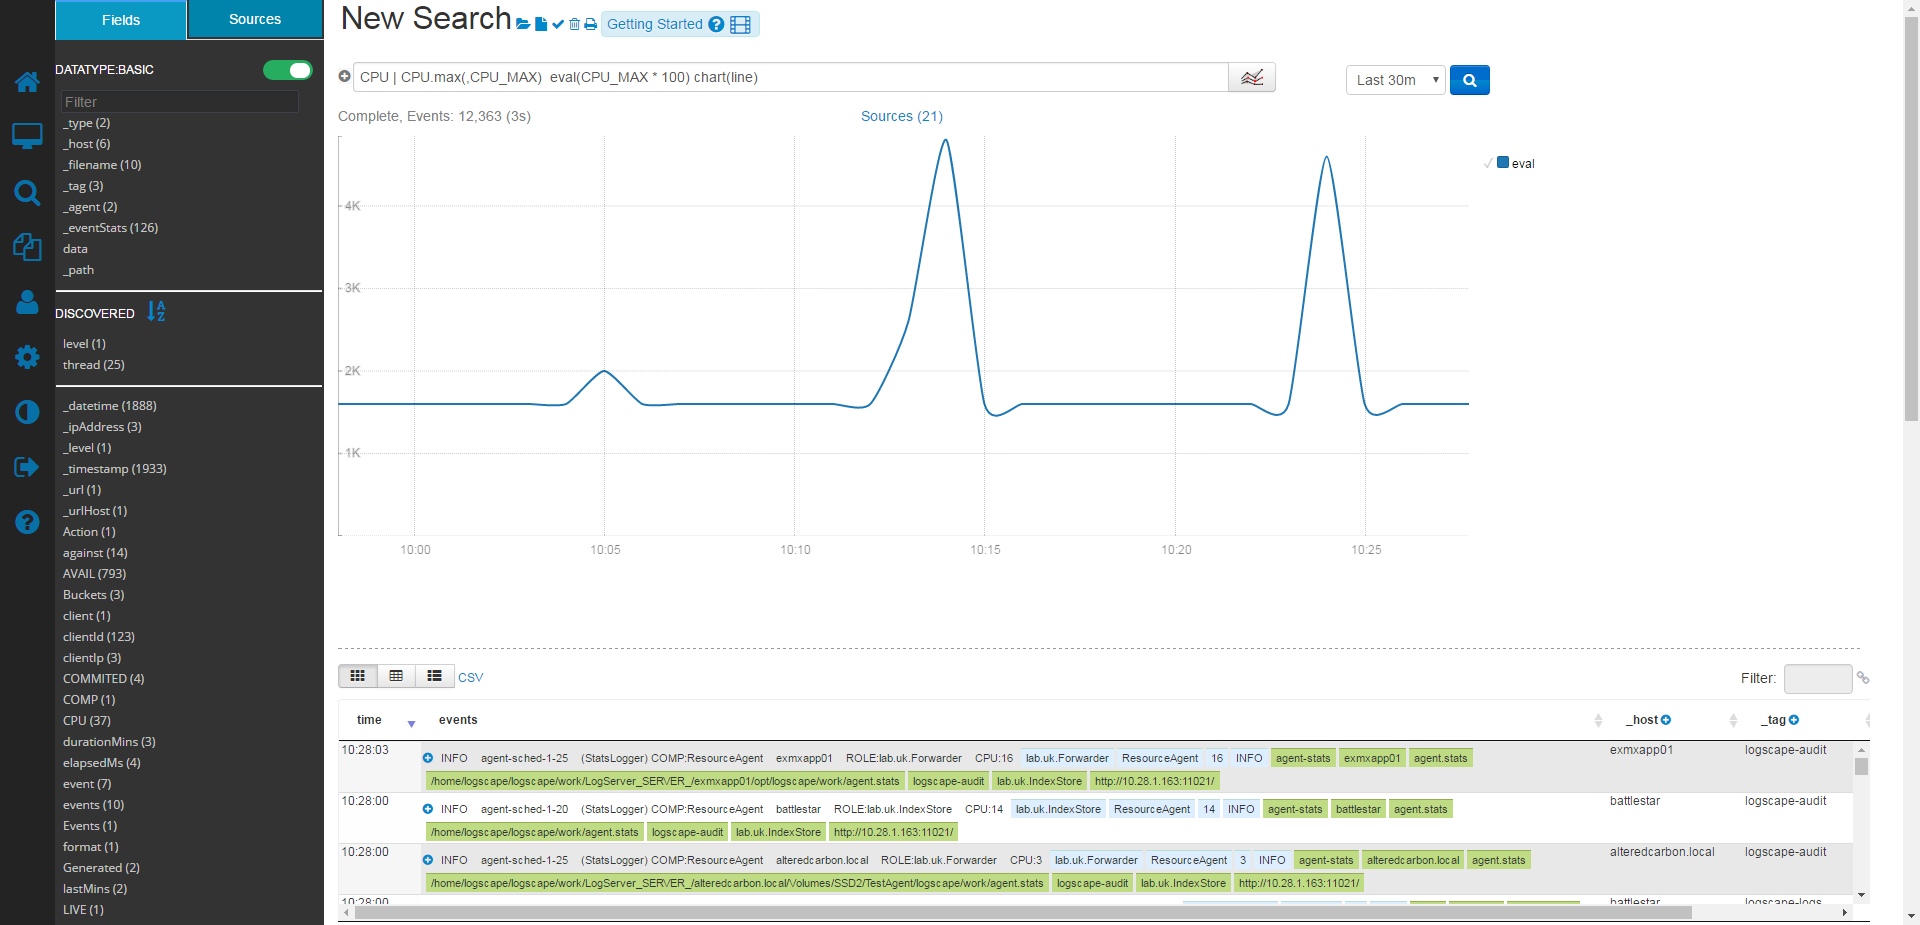
    You can also use eval on alias fieleds, such as

    CPU | CPU.max(,CPU_MAX) eval(CPU_MAX * 100)

  • trend()

    Applies an average across the past 10 and 20 buckets for the value, and plots both lines, by default named _10 and _20.

    Examples:

    * | _type.equals(Unx-CPU) Cpu.trend(,AverageAcross) buckets(5m)

    Due to the 5 minute bucket size, trend would provide averages from past 50 and past 100 minutes.