A table is an aggregate chart type and operates on data across on a single bucket denoted by
buckets(1)
in the search expression.Tables are perfect for aggregating analytic results into similar groups. The data can be further enhanced with links,heatmaps and field annotations.
Type in a search. For example:
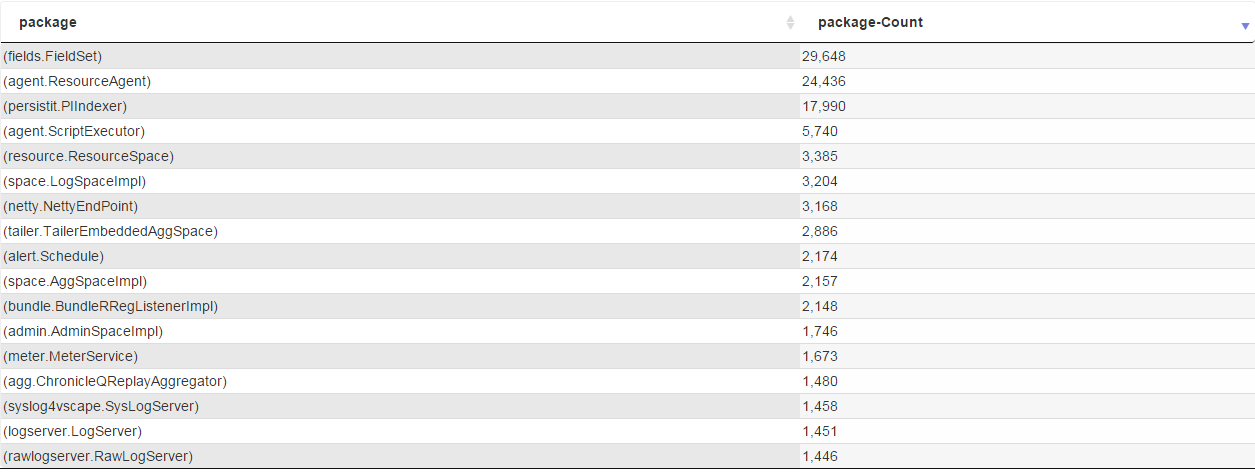
* | _type.equals(log4j) package.count()
Then select the table chart type and your search will be changed to that of a table. The search would look like this
* | _type.equals(log4j) package.count() chart(table) buckets(1)
And the chart rendered like this:

Using the 'by' function -
* | _type.equals(log4j) package.by(_host) level.by(_host) chart(table) buckets(1)
Aggregate Functions -
* | _type.equals(Unx-CPU) CPUUtilPct.max(server,) CpuUtilPct.min(server,) CpuUtilPct.avg(server,) chart(table) buckets(1)
Time Series -
Omitting the 'buckets(1)' term will apply the analytic function and group against the time bucket for that search. Eg -* | _type.equals(Unx-CPU) CpuUtilPct.max() CpuUtilPct.avg() CpuUtilPct.min() chart(table)
Column Titles - You can use custom titles for your table by providing a custom title as a second parameter e.g
Cost.sum(,Totals)
Annotating Data - It is possible to provide descriptions to annotate chart.
HeatMaps - Table values can be heatmapped. See Heatmap for more details.