Every search analytic that builds a search visualization processes the data according to its algorithm in order to create it (count, avg etc). The problem is that if you have searches that run over the same data again and again for long periods of time, i.e 3 months, or 6 months, then these searches will be very slow due to the volume of data. The introduction of 'summary.index()' allows for pre-built search results at a particular granularity (10 minute default). When searching against a summary index, these 10 minute buckets are read, and turned into hour buckets, as all this data is pre-compiled there is no expensive searches taking place, instead Logscape is simply fetching from the index.
The BenefitYou've been writing to an index to track CPU Usage throughout your environment, you've been doing so for the past 12 months, ordinarily performing a search over this data would be expensive, meaning it would take an incredibly long time. In comparison, a search that used to take 1 minute to return, will on average return in 10 seconds when using a summary, allowing you to easily spot long running trends.
Due to how the summary index works however, neither facets or replay events are available, instead analysis must be based upon the visual graph, with indepth searches coming later.
Execute desired search with summary.index(write)
* | _type.equals(UNX-Cpu) CpuUserPct.avg(server) chart(line) ttl(10) summary.index(write)
With the identical search use summary.index(read).
* | _type.equals(UNX-Cpu) CpuUserPct.avg(server) chart(line) ttl(10) summary.index(read)
summary.index(delete) will delete the whole index regardless of time-period
* | _type.equals(UNX-Cpu) CpuUserPct.avg(server) chart(line) ttl(10) summary.index(delete)
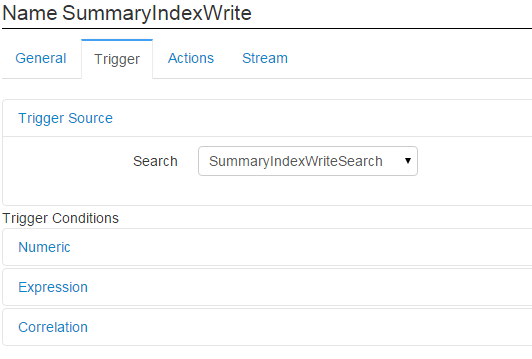
To maintain the Index, schedule a periodic search that uses the 'summary.index(write)' command to keep extending the indexed timeframe, this can be achieved by saving your 'summary.index(write)' search and including it in an alert as the alert trigger, there is no need to set any actions.
Alternatively you can make use of summary.index(auto) where an index is not discovered, an index will be created. If an index exists, data will be read from it, and any data missing will automatically be added to the index, making maintaing your index easier.
* | _type.equals(UNX-Cpu) CpuUserPct.avg(server) chart(line) ttl(10) summary.index(auto)

The summary index makes use of a bloom filter to prevent over-writing, so when in doubt you can execute a long 'write' to fill in any gaps that may have occurred, when performing this action it is advised to override Logscape's default time to to live, by including 'ttl(time in minutes)' in your search.
Due to the nature of the summary which does not provide facets or replay events, you will likely wish to remove the summary when linking through your workspaces to allow for proper root cause analysis.
Debugging the summary indexBy setting the flag "sidx.xstream" to true in the agent.properties file, '-Dsidx.xstream=true', you can change your summary data to being output in XML format, your 'work/DB/sidx' folder should be clean before doing so. This allows you to see what data is being written to file in a human readable format, however it will use more disk space, as well as slowing search speeds so should only be used for debugging purposes.
Turn off the Logscape instance
Delete the '/work/DB/six' folder
Modify the agent.properties file to include '-Dsidx.xstream=true'
Restart the Logscape instance
It is also possible to set a log4j logging level in order to monitor the process of writing to, and reading from the summary index, this can be achieved by modifying the 'agent-log4j.properties' file to include ' com.liquidlabs.log.search.summaryindex=DEBUG '
Turn off the Logscape instance
Modify the agent-log4j.properties file to include 'com.liquidlabs.log.search.summaryindex=DEBUG'
Restart the Logscape instance