
Post Aggregates work by using the results of an analytic as the input for another - This allows you to perform analytics on data that is formatted in a way which would not normally be available. For instance, performing the search 'profit.sum(region,RgnProf)', RgnProf could be used to determine which region was the most profitable. Similarily it can be used to monitor resource metrics.
Take the following search,
Agent and cpu | CPU.max(_host,POST)
This search would simply display the maximum cpu by host, using post aggregates we can add '+POST.max(,Max) +POST.min(,Min) +POST.avg(,Avg) chart (c3.area)' and get
Agent AND cpu | CPU.max(_host,POST) +POST.max(,Max) +POST.min(,Min) +POST.avg(,Avg) chart(c3.area)
This shows you your CPU utilisation spread. With it, you can see the spread between your minimum and maximum CPU laden machines, with the average as an indicator. On almost any environment, you'd expect to see the Max much higher than the average – that means a few boxes are straining and the rest are coasting. The larger the gap, the more uneven your workload is spread.
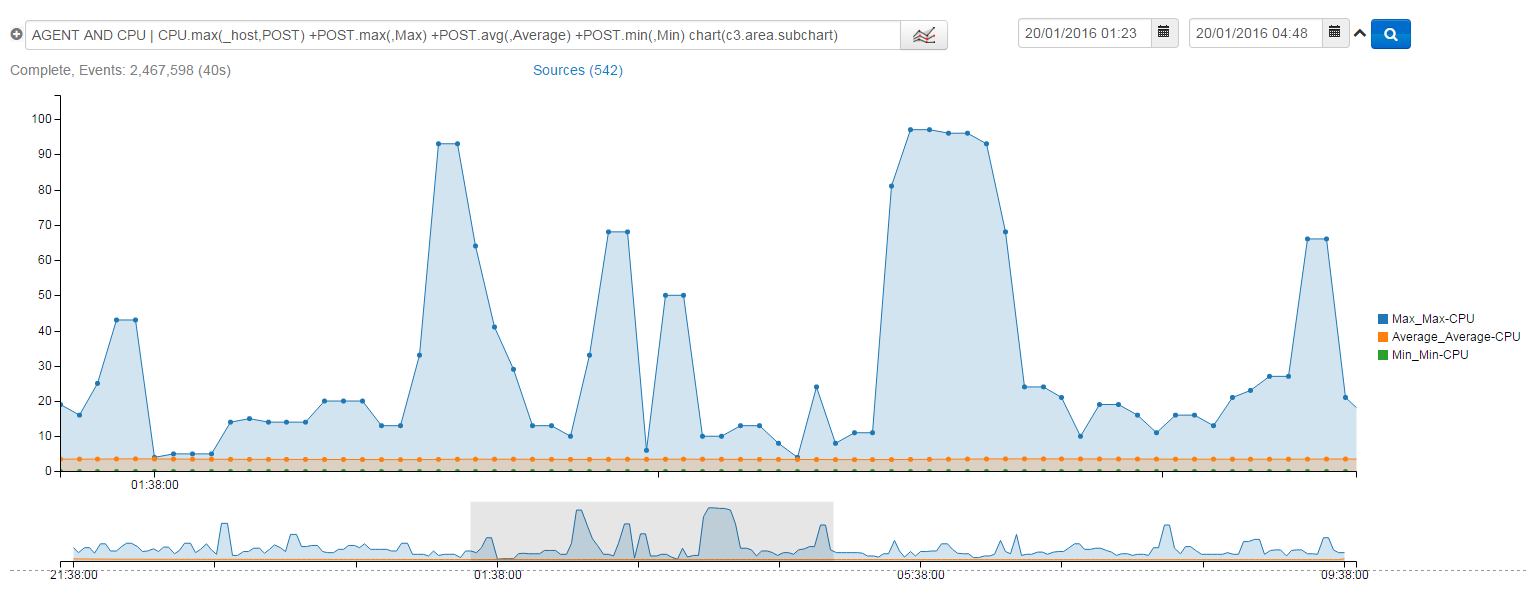
In the above case, you can see that maximum load is massively varied as work goes through the system, however to the left of the chart when load was lower, all three bands bore close resemblance.
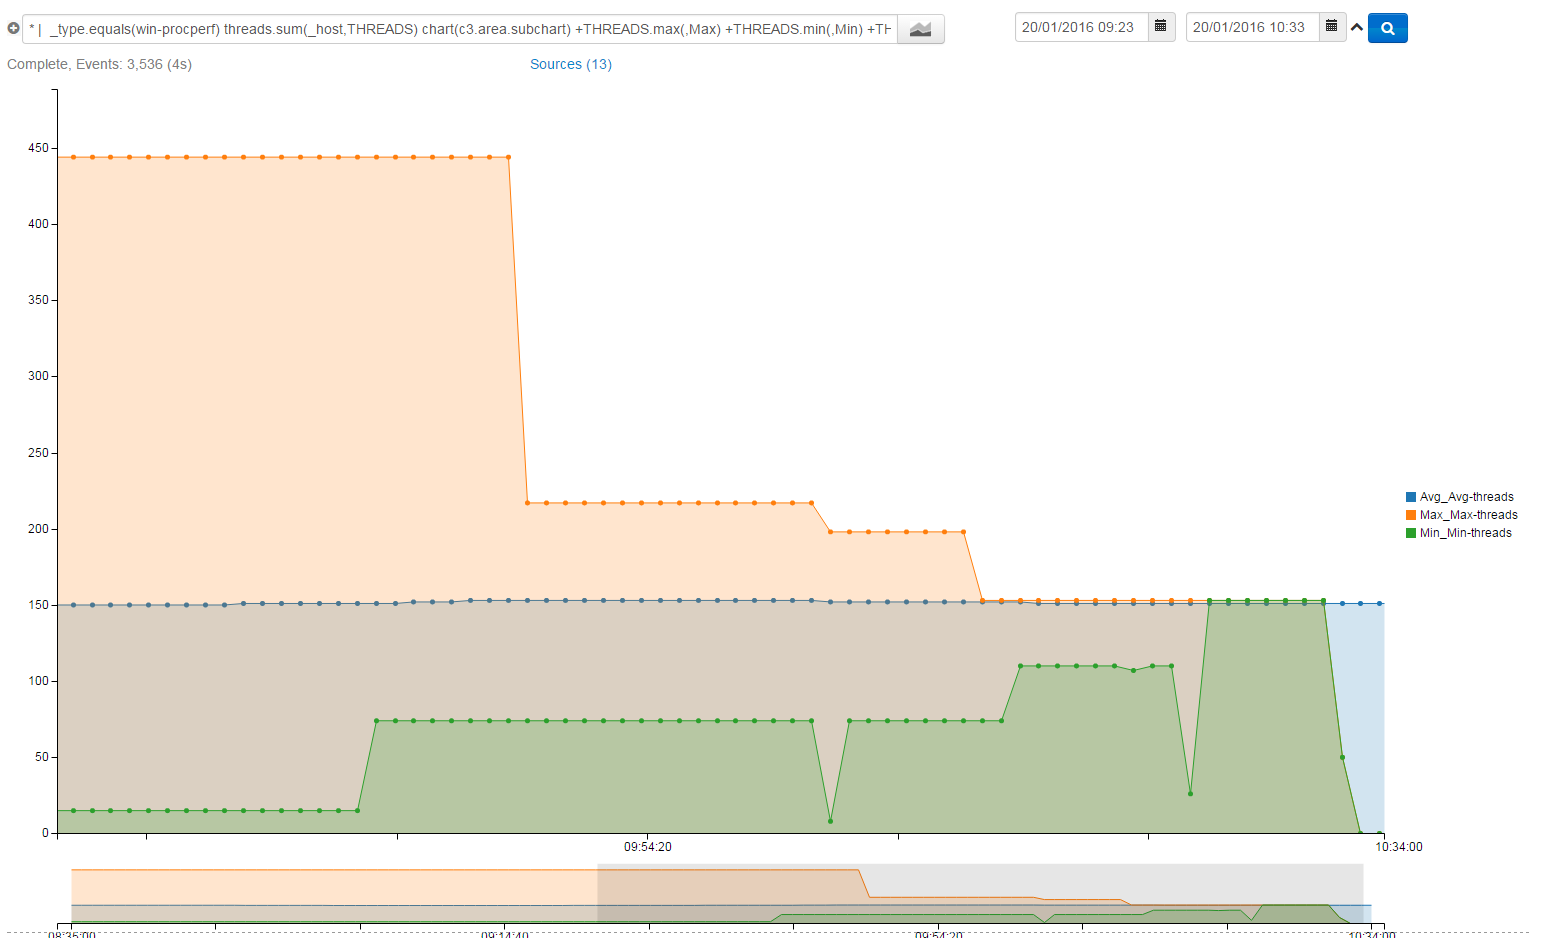
We can perform a similar example using the WindowsApp.
*| _type.equals(win-procpref) threads.sum(_host,THREADS) +THREADS.max(,Max) +THREADS.min(,Min) +THREADS.avg(,Avg) bucketWidth (1m) chart(c3.area)
This search will show the minimum, average and maximum running threads on the system, looking at the graph below it is strikingly obvious when a large program is closed, releasing the threads.
Using post aggregates it is of course possible to filter as per usual. Which means for example.
Agent and cpu | CPU.max(_host,POST) +POST.gt(75)
Would limit to only showing me information when the post aggregated value is above 75.
Hopefully this has allowed you to understand the power of Post Aggregates in Logscape.
